Fit Atomic Coordinates to PCS data
This example shows how to calculate the region in space (also referred to as localisation space) which is likely for atomic coordinates from PCS measurements. The example uses multiple \({\Delta\chi}\)-tensors are used from different tagging sites in the protein IMP-1 to localise a tryptophan sidechain in a loop.
The script fits the \({\Delta\chi}\)-tensors to a crystal structure of IMP-1 using backbone PCS data and then samples 20 perturbed tensors using a bootstrap fitting. The sampled tensors improve stability of the final calculation. The script then calculates the RMSD between experimental and back-calculated PCS values for nuclei in the sidechain of tryptophan at residue 28 on a grid of points. The grid, which defines the localisation space, is then viewed in PyMOL.
Downloads
Download the data files
5ev6AH.pdband all IMP-1 datasets from here:Download the script
pcs_fit_atom.py
Script + Explanation
After importing modules from Paramagpy, the tagging sites and lanthanoid ions are specified as tuple variables. The PDB file is loaded. The atoms list contains the atoms of interest (in this case the NH and adjacent CH protons of tryptophan 28). Finally the number of bootstrap iterations are defined.
from paramagpy import protein, fit, dataparse, metal
import re

sites = 'A53C-C2', 'N172C-C2', 'S204C-C2', 'N172C-C12'
ions = 'Tm', 'Tb'
pdb_path = "../data_files/5ev6AH.pdb"
prot = protein.load_pdb(pdb_path)
atomns = 'H07', 'H08'
atoms = [prot[0]['A'][28][atomn] for atomn in atomns]
BOOTSTRAP_ITER = 20
Two dictionaries are specified to define the final colours and RMSD contour levels to be plotted in PyMOL.
# Isosurface colours
surface_colours = {
	(ions[0], atomns[0]): 'teal',
	(ions[1], atomns[0]): 'blue',
	(ions[0], atomns[1]): 'magenta',
	(ions[1], atomns[1]): 'red',
}

# RMSD contour levels
surface_contour = {
	(ions[0], atomns[0]): 0.04,
	(ions[1], atomns[0]): 0.04,
	(ions[0], atomns[1]): 0.016,
	(ions[1], atomns[1]): 0.02,
}
A PyMOL script object paramagpy.protein.PyMOLScript is created and the PDB is added to it. This object makes it easy to add density maps, PDBs and spheres to PyMOL from Paramagpy.
pmlscript = protein.PyMolScript()
pmlscript.add_pdb(path=pdb_path, name='5ev6')
Next is a rather involved loop that iterates of the tagging sites, fits the \({\Delta\chi}\)-tensor using a simultaneous fit between Tm and Tb data and finally samples the tensor fits using bootstrap. The fitted tensors are bundled into the variable mdata.
mdata = []
for site in sites: # Loop over sites
	bindingSite = int(re.search("\\d+", site).group()) # Get residue number
	mStart = metal.Metal()
	mStart.position = prot[0]['A'][bindingSite]['CA'].position # Set strating position

	hnpcss = []
	# Assemble exp. PCS data for both ions
	for ion in ions:
		hnpcs_raw = dataparse.read_pcs("../data_files/IMP1_HN_{}_{}_FREE.npc".format(site, ion))
		hnpcs = prot.parse(hnpcs_raw)
		hnpcss.append(hnpcs)

	# Fit the tensor by SVD, then NLR
	mGuess, _ = fit.svd_gridsearch_fit_metal_from_pcs([mStart, mStart], hnpcss)
	mFit, _ = fit.nlr_fit_metal_from_pcs(mGuess, hnpcss)

	# Sample purturbed tensors by bootstrap
	mSamples, mStd = fit.fit_error_bootstrap(
		fit.nlr_fit_metal_from_pcs,
		BOOTSTRAP_ITER,
		0.8,
		initMetals=mFit,
		dataArrays=hnpcss
	)

	mdata.append(mSamples)
The fitted \({\Delta\chi}\)-tensors are then unzipped (to allow iterating over each ion) and assembled with the tryptophan PCS data in two lists mdata and trpdata. For each data array contained in trpdata there must be an associated tensor contained in mdata, so that is why they are constructed side by side.
for ion, mSamples in zip(ions, zip(*mdata)):
	trpdata = []
	mdata = []
	# Loop sites with fitted tensors
	for site, mSample in zip(sites, mSamples):
		# Load TRP PCS data
		trppcs_raw = dataparse.read_pcs("../data_files/IMP1_TRP_{}_{}_FREE.npc".format(site, ion))
		trppcs = prot.parse(trppcs_raw)

		# Assemble associated lists of atoms/PCS with tensors
		for atom in atoms:
			dataselect = trppcs[trppcs['atm'] == atom]
			if len(dataselect)>0:
				for m in mSample:
					trpdata.append(dataselect)
					mdata.append(m)
The function paramagpy.fit.gridsearch_fit_atom_from_pcs() is called which calculates the PCS RMSD on a grid as defined by the function arguments mapSize and mapDensity. This function returns a dictionary which contains keys for the atoms of the PDB files and values of paramagpy.fit.DensityMap which define the grid of PCS RMSD values.
What remains of the script is to add the PCS RMSD grid to the PyMOL script and save it so that it plots with the specified colours and contour levels. What results is a volume which contains all points that have an RMSD less than the specified isoVals value. Finally some standard PyMOL commands are added to display the protein structure as desired.
	for atom in atoms:
		mapname = "{}{}map".format(atom.id, ion)
		dmapFilePath = "{}.ccp4".format(mapname)
		gridsVol[atom].write(dmapFilePath)
		pmlscript.add_map(
			path=dmapFilePath,
			name=mapname,
			isoVals=[surface_contour[(ion, atom.id)]],
			colours=[surface_colours[(ion, atom.id)]],
			surfaceType='isodot',
		)

pmlscript += "set dot_radius, 0.05"
pmlscript += "show sticks, ////28 and sc."
pmlscript += "show sticks, ////28/CA"
pmlscript += "set bg_rgb=[1,1,1]"
pmlscript += "set mesh_width, 0.5"
pmlscript += "zoom ////28/H07\n"
pmlscript += """
set_view (\
     0.505656540,   -0.827194929,   -0.245069817,\
    -0.741597414,   -0.561904311,    0.366465807,\
    -0.440846384,   -0.003562994,   -0.897575319,\
     0.000152570,    0.000080852,  -36.169487000,\
    48.539413452,   83.819839478,   42.674442291,\
    26.907037735,   45.422363281,  -20.000000000 )
"""
pmlscript += "ray 1600"
pmlscript += "png pcs_fit_atom.png"
pmlscript.write("pcs_fit_atom.pml")
This generates the following PyMOL script which allows viewing of the PCS RMSD region. pcs_fit_atom.pml. After opening the script in PyMOL the following image is generated.
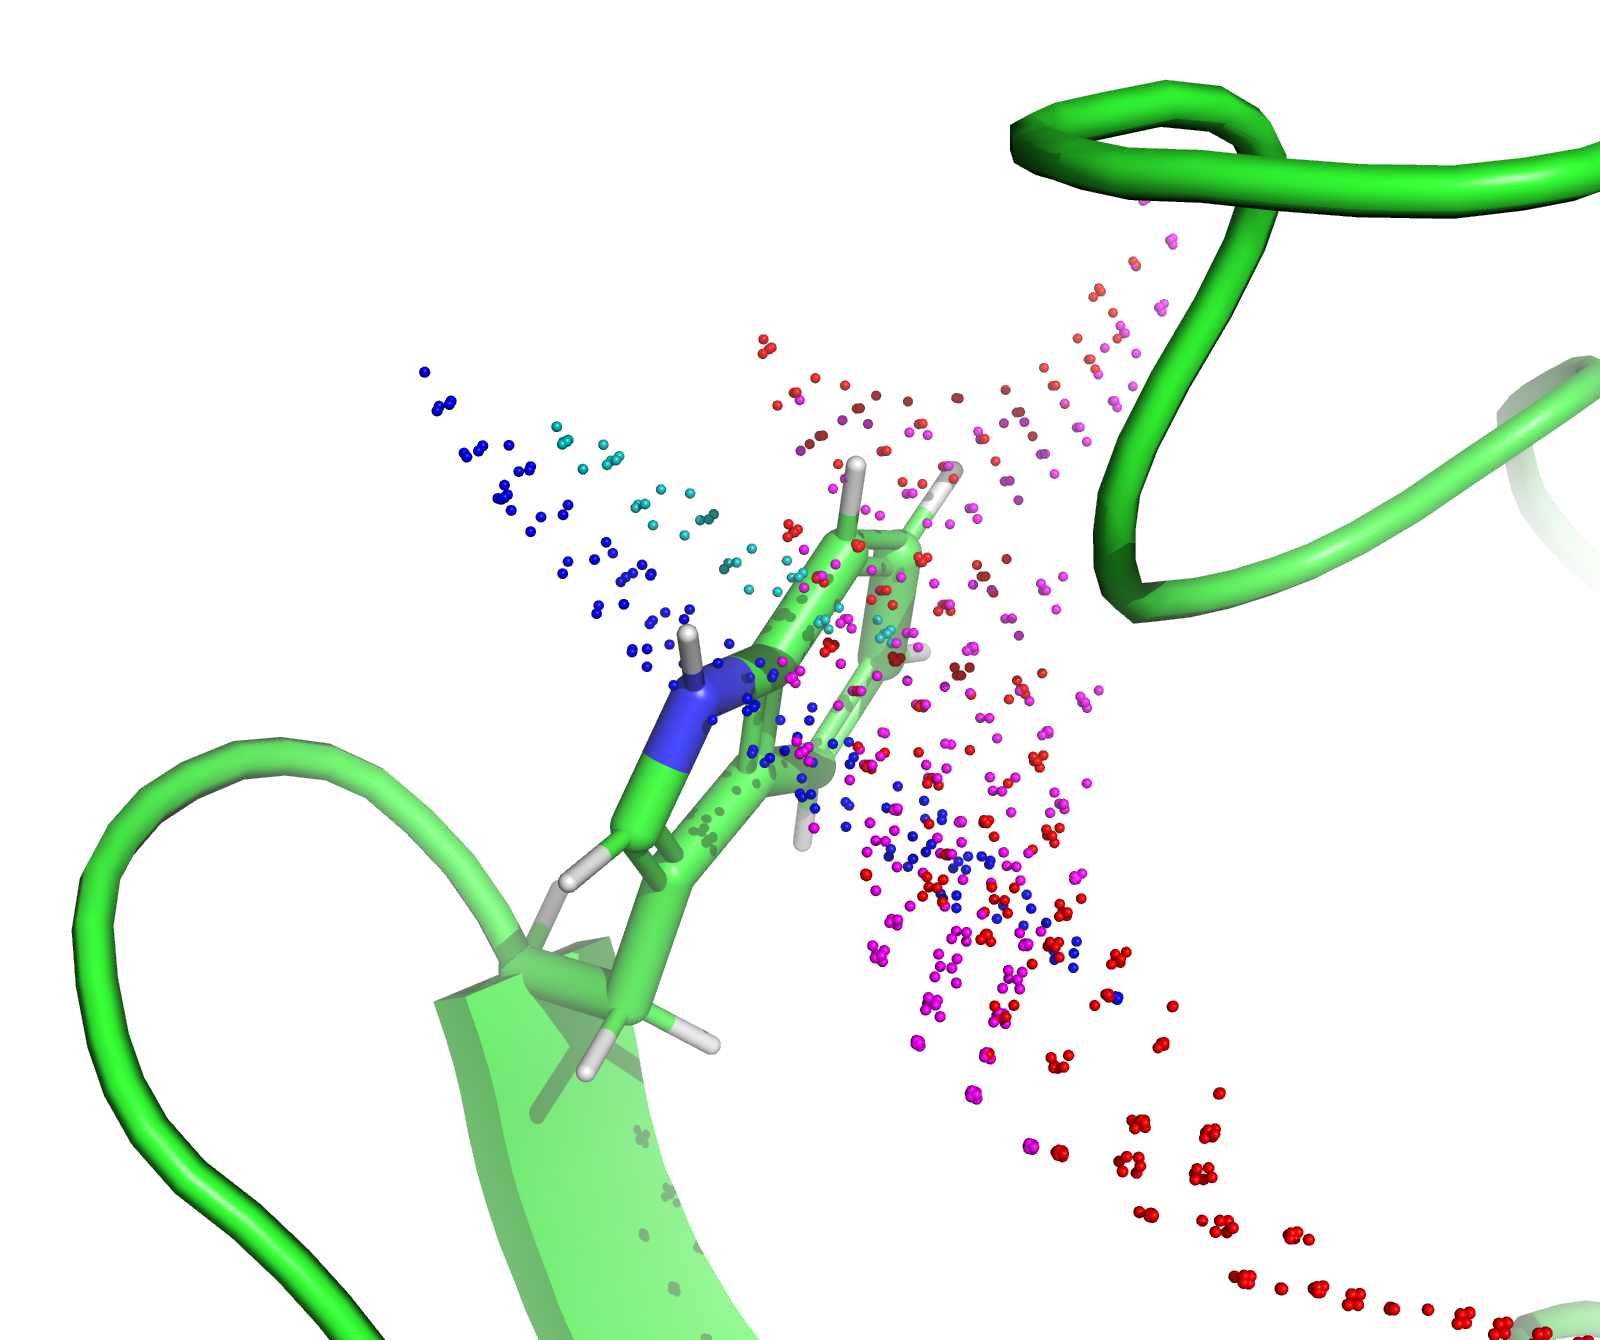
