Fit a tensor to PCS data with uncertainties
This example shows how to conduct a weighted fit of a \({\Delta\chi}\)-tensor to experimental PCS data with experimental errors.
Downloads
Download the data files
4icbH_mut.pdbandcalbindin_Er_HN_PCS_errors.npcfrom here:Download the script
pcs_fit_error.py
Script + Explanation
This script follows very closely the script Fit Tensor to PCS Data. The only difference being that errors are included in the fourth column of the .npc file and errorbars are included in the plotting routine.
from paramagpy import protein, fit, dataparse, metal
# Load the PDB file
prot = protein.load_pdb('../data_files/4icbH_mut.pdb')
# Load the PCS data
rawData = dataparse.read_pcs('../data_files/calbindin_Er_HN_PCS_errors.npc')
# Associate PCS data with atoms of the PDB
parsedData = prot.parse(rawData)
# Define an initial tensor
mStart = metal.Metal()
# Set the starting position to an atom close to the metal
mStart.position = prot[0]['A'][56]['CA'].position
# Calculate an initial tensor from an SVD gridsearch
[mGuess], [data] = fit.svd_gridsearch_fit_metal_from_pcs(
[mStart],[parsedData], radius=10, points=10)
# Refine the tensor using non-linear regression
[mFit], [data] = fit.nlr_fit_metal_from_pcs([mGuess], [parsedData])
qfac = fit.qfactor(data)
# Save the fitted tensor to file
mFit.save('calbindin_Er_HN_PCS_tensor_errors.txt')
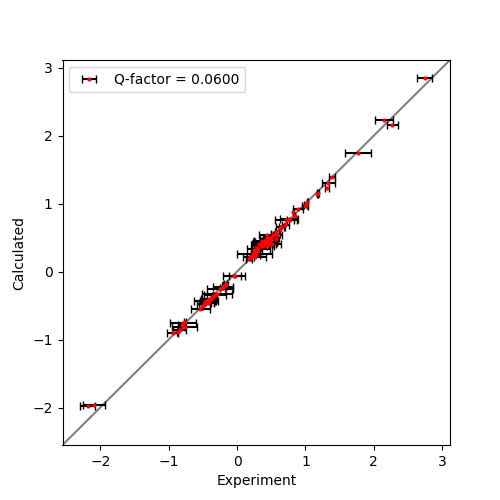
#### Plot the correlation ####
from matplotlib import pyplot as plt
fig, ax = plt.subplots(figsize=(5,5))
# Plot the data
ax.errorbar(data['exp'], data['cal'], xerr=data['err'], fmt='o', c='r', ms=2,
ecolor='k', capsize=3, label="Q-factor = {:5.4f}".format(qfac))
# Plot a diagonal
l, h = ax.get_xlim()
ax.plot([l,h],[l,h],'grey',zorder=0)
ax.set_xlim(l,h)
ax.set_ylim(l,h)
# Make axis labels and save figure
ax.set_xlabel("Experiment")
ax.set_ylabel("Calculated")
ax.legend()
fig.savefig("pcs_fit_error.png")
The fitted tensor:
Output: [calbindin_Er_HN_PCS_tensor_errors.txt]
ax    | 1E-32 m^3 :    -8.012
rh    | 1E-32 m^3 :    -4.125
x     |   1E-10 m :    24.892
y     |   1E-10 m :     8.456
z     |   1E-10 m :     6.287
a     |       deg :   112.440
b     |       deg :   135.924
g     |       deg :    46.210
mueff |        Bm :     0.000
shift |       ppm :     0.000
B0    |         T :    18.790
temp  |         K :   298.150
t1e   |        ps :     0.000
taur  |        ns :     0.000
And correlation plot:
Output: [pcs_fit_error.png]