Plot PCS isosurface (PyMol view)
This example shows how to plot the PCS isosurface of a fitted \({\Delta\chi}\)-tensor for data from the example Fit Tensor to PCS Data. The isosurface can be viewed in PyMol.
Downloads
Download the data files
4icbH_mut.pdbandcalbindin_Er_HN_PCS_tensor.txtfrom here:Download the script pcs_plot_isosurface.py
Explanation
The protein and tensor are loaded as described previously in.
The isosurface files are generated using the function paramagpy.metal.Metal.isomap(). The contour level can be chosen by setting the isoval argument. A larger density value will result in a smoother surface. This function writes two files isomap.pml and isomap.pml.ccp4 which are the PyMol script and PCS grid files respectively.
The isosurface can be displayed by executing pymol isomap.pml from a terminal, or by selecting File>Run and navigating to the script isomap.pml.
Script
from paramagpy import protein, fit, dataparse, metal

# Load the PDB file
prot = protein.load_pdb('../data_files/4icbH_mut.pdb')

# Load the fitted tensor
met = metal.load_tensor('../data_files/calbindin_Er_HN_PCS_tensor.txt')

# Plot the isosurface to be opened in PyMol
met.isomap(prot.id, density=1, isoval=1.0)
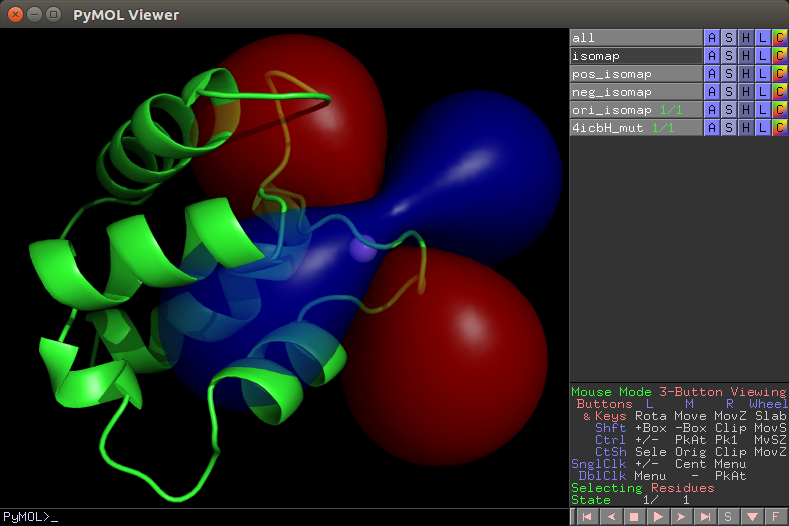
Output
PyMol view of isosurface